Low interaction burden
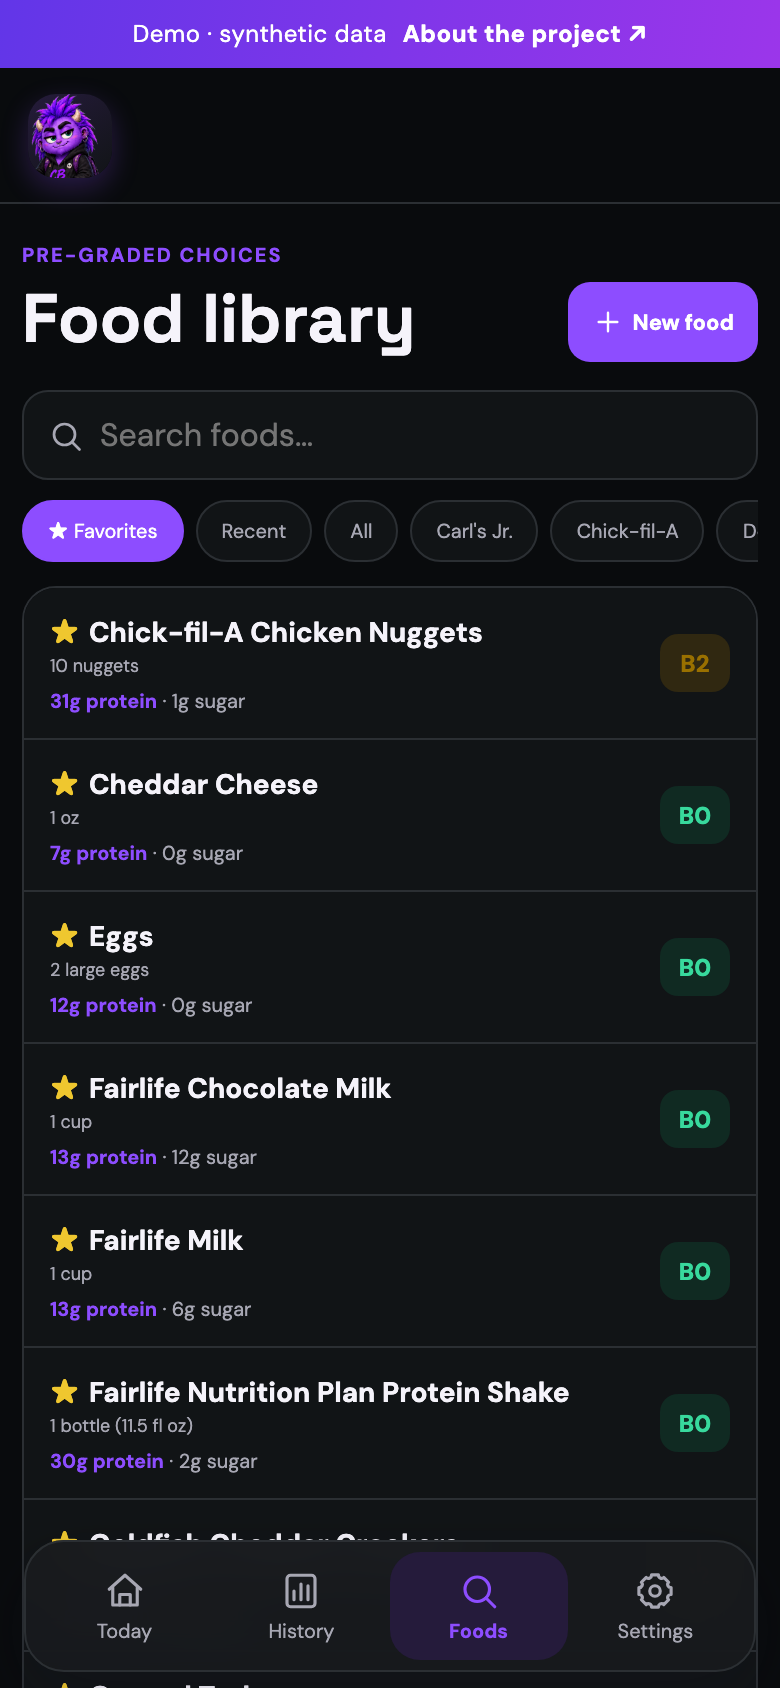
Select a familiar food, adjust the serving, and record it.

A family-designed food-awareness and pattern-tracking tool for a young person living with Crohn’s disease and a small-intestinal stricture.
Project premise. Protein remains the primary positive goal, with sugar and a rolling estimate of recent food load presented as supporting guardrails. The application is designed for awareness and shared learning—not diagnosis, treatment, or symptom prediction.

The visual identity is intentionally approachable; interpretation remains conservative.
Chronie Bronie is a mobile-first, family-designed tracking application created around one practical problem: helping a young person with Crohn’s disease and a small-intestinal stricture recognize when the texture and cumulative burden of recently eaten foods may deserve attention, without moralizing food or claiming to predict obstruction.
The application combines a positive protein goal, sugar tracking, a pre-graded food library, a rolling Bronie Meter, and a brief nightly self check-in. Its central design decision is the separation of a food’s B0–B4 reference grade from a continuous, time-decaying daily load score. The grade supports quick logging; the meter reflects dose, timing, and accumulation.
Gluten is not treated as a direct cause of Crohn’s disease or as an inherently undesirable ingredient. The practical concern is mechanical: certain foods, textures, or combinations may be harder to move through a narrowed segment of small intestine, particularly when several higher-burden choices are eaten close together. Precision is not assumed at the outset. The objective is to identify plausible patterns and allow lived experience to refine the model.
Select a familiar food, adjust the serving, and record it.
The library reflects a manageable set of foods actually eaten.
No “good food/bad food” language and no claim that a score predicts symptoms.
The meter exposes its score and the foods contributing most.
Parent controls allow refinement while preserving mathematical constraints.
Observations support discussion with clinicians; they do not replace care.
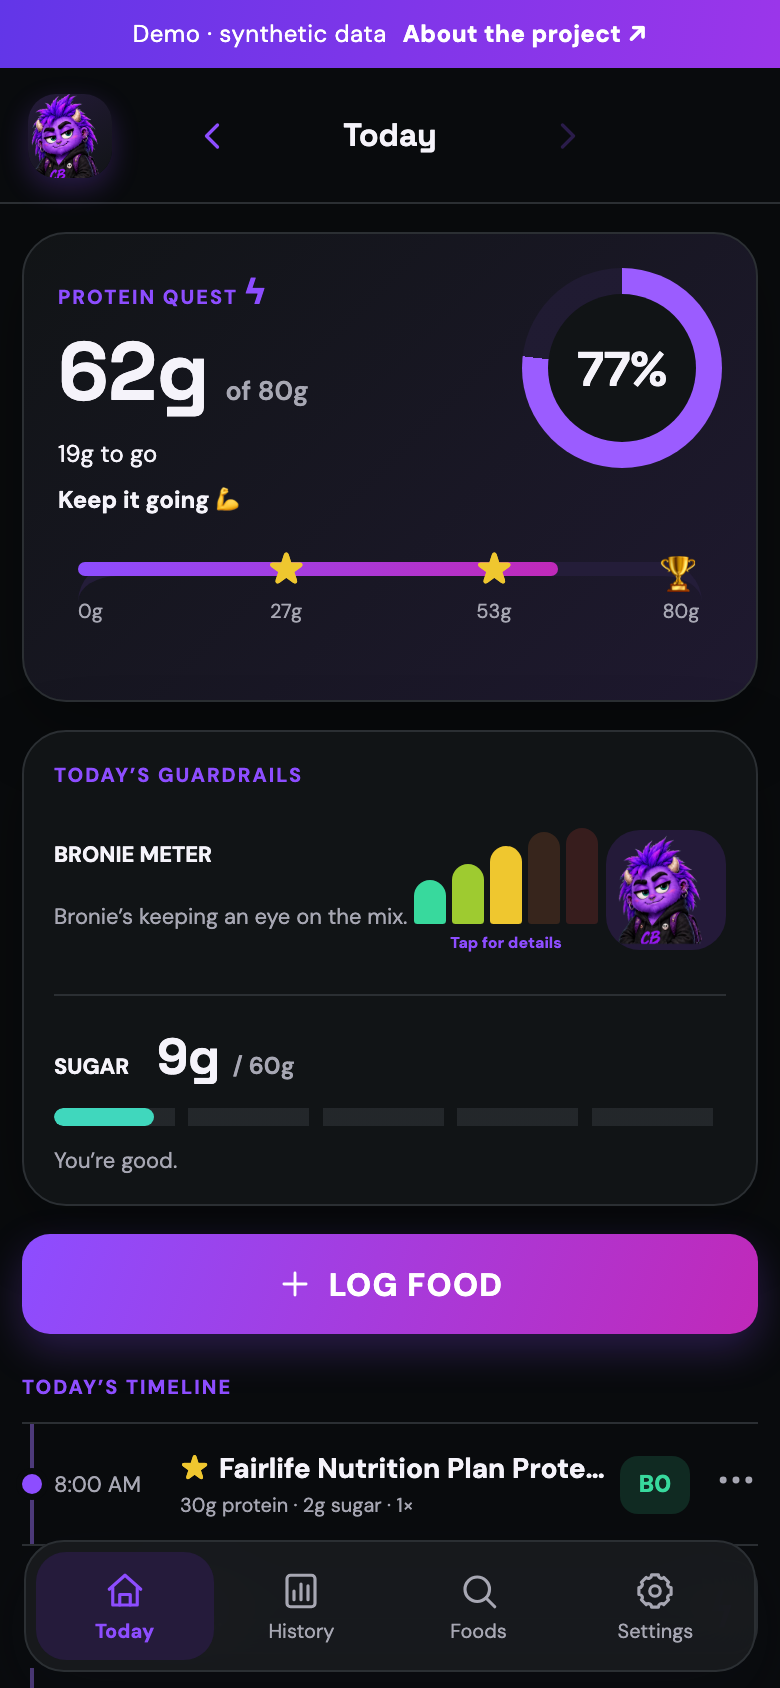
The Today screen presents protein progress toward a daily goal, sugar against a configurable daily limit, and a rolling Bronie Meter that summarizes recent cumulative food load. The timeline preserves the underlying record so the meter does not become an unexplained verdict.
Each familiar food receives a family-defined starting estimate of potential mechanical burden in the context of a known stricture. It is not a gluten scale, nutrition score, or medical risk classification.
| Grade | Working interpretation | Typical characteristics | Illustrative examples |
|---|---|---|---|
| B0 | Minimal expected burden | Smooth, soft, low-residue, or liquid | Milk, yogurt, eggs, smooth cheese |
| B1 | Low burden | Generally soft or refined; modest texture | Soft tortillas, rice, tender ground foods |
| B2 | Moderate burden | Breaded, dry, dense, or refined wheat-based | Crackers, nuggets, fries, plain burgers |
| B3 | Higher burden | Dense dough, larger refined-wheat portions, or tougher texture | Pizza, sandwiches, pretzels, bagels |
| B4 | Highest starting caution | Hard-to-chew, stringy, seeded, fibrous, dry, or personally difficult | Foods individualized from experience and clinician guidance |
The meter is a separate continuous score. It allows low-grade foods to accumulate without implying that several B1 foods are automatically equivalent to one B4 food, and lets every food’s effect diminish over time.
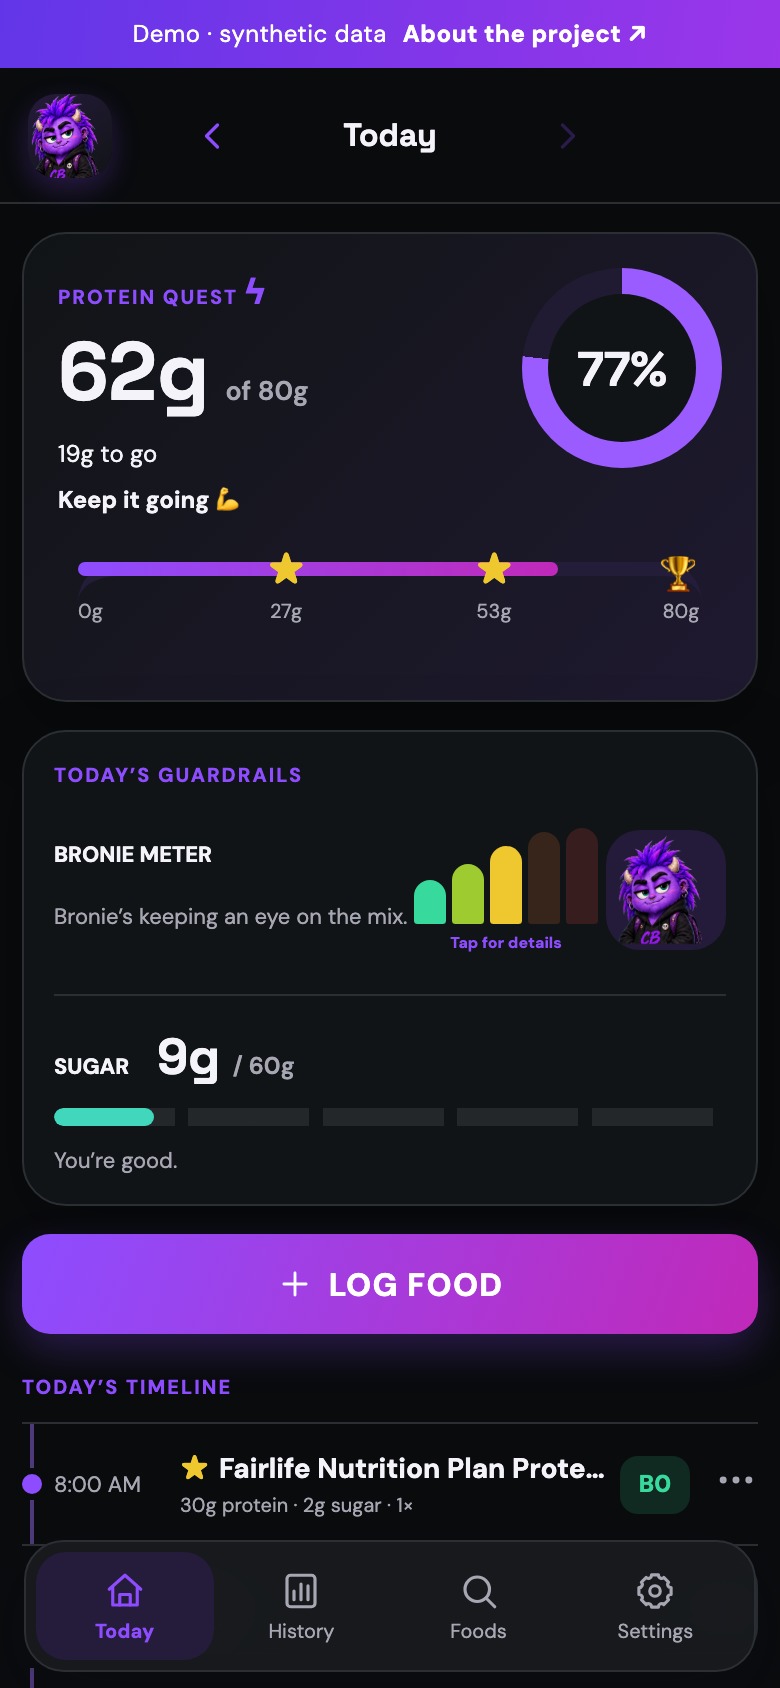
baseᵢ = gradeImpact(Bᵢ) × servingsᵢ0.75Bronie load = 0.70 × Σ recentᵢ + 0.30 × Σ dayᵢTapping the visual meter exposes the continuous score, the recent and 24-hour components, and a ranked list of the foods contributing most. The primary meter does not display a B number, avoiding confusion between a time-sensitive score and an individual food grade.
| Element | Current default | Purpose |
|---|---|---|
| Food-grade weights | B0=0; B1=1; B2=3; B3=7; B4=15 | Makes higher grades disproportionately influential. |
| Serving adjustment | servings0.75 | Adds burden for more food while softening simple multiplication. |
| Recent component | 0–2h: 100%; 2–4h: 70%; 4–6h: 40%; 6–8h: 15% | Responds to clustered intake and reaches zero after eight hours. |
| 24-hour component | 0–6h: 100%; 6–12h: 65%; 12–18h: 35%; 18–24h: 15% | Retains slower context from the remainder of the day. |
| Component blend | 70% recent + 30% 24-hour | Prioritizes recent intake without discarding earlier context. |
| Display thresholds | <4; 4–7.9; 8–13.9; ≥14 | Maps the score to Cruising, Heads up, Take it easy, and Bronie zone. |
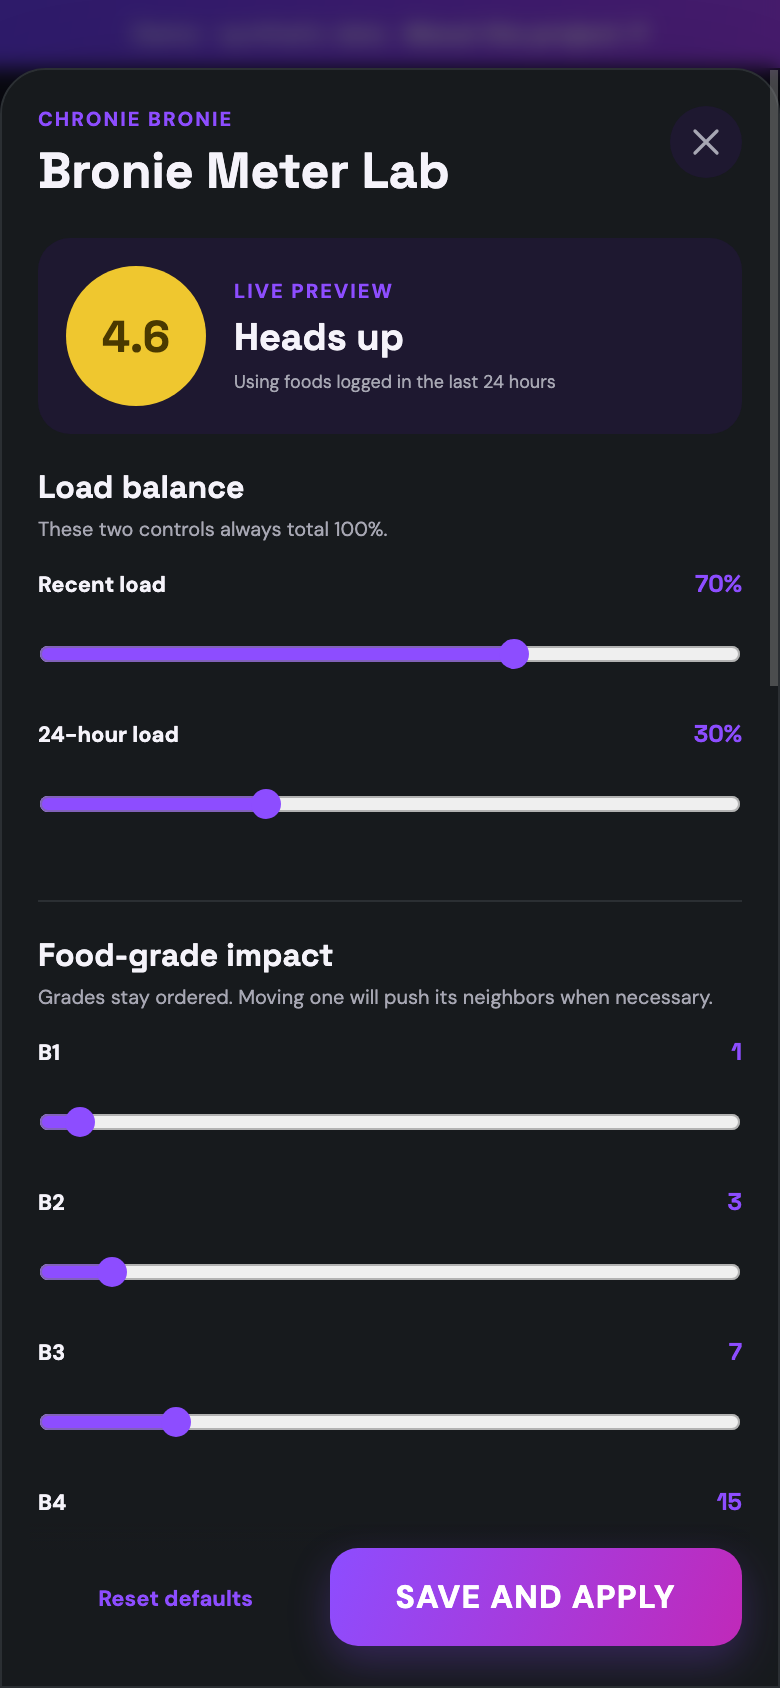
A parent or administrator taps Settings → About Bronie Factor five times to open the implemented calibration screen. The controls modify the model while enforcing internal mathematical constraints.
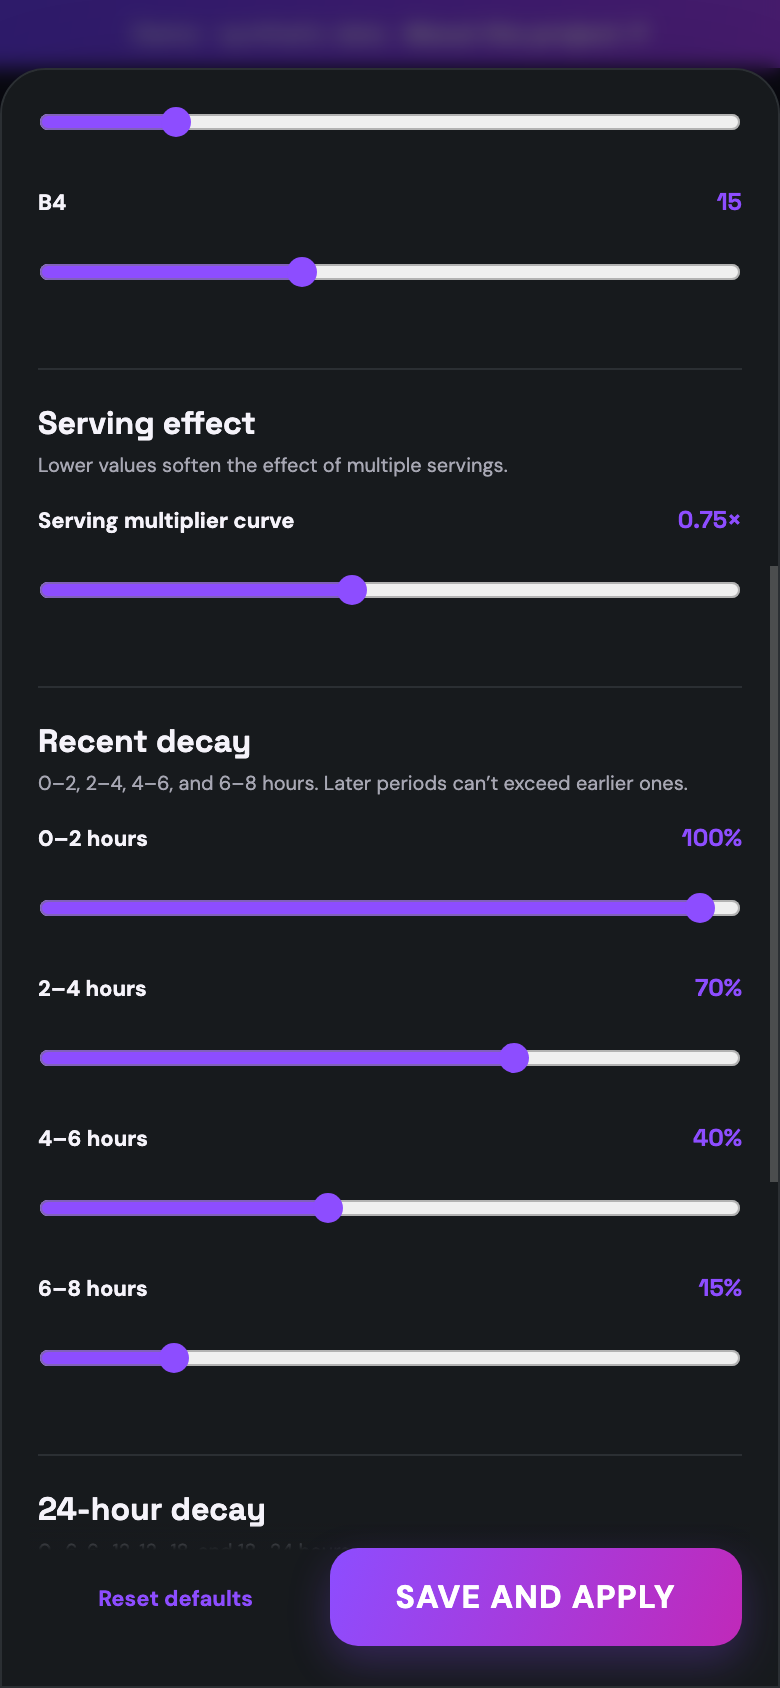
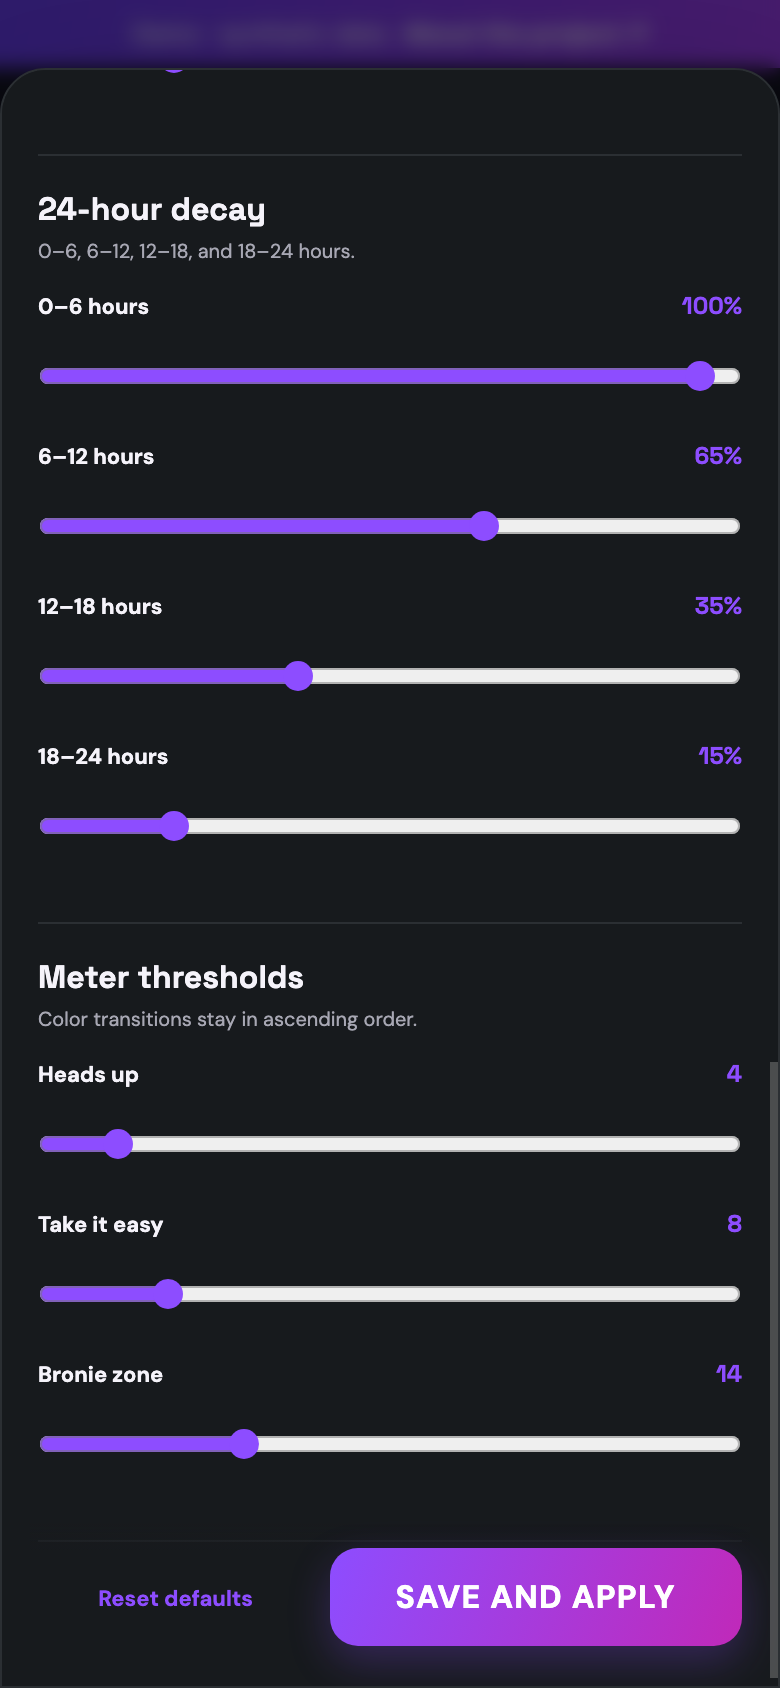
| Control group | Adjustable values | Dependency behavior |
|---|---|---|
| Grade weights | B1–B4; B0 fixed at zero | Maintains B1 < B2 < B3 < B4. Moving one control nudges neighbors when required. |
| Blend | Recent and 24-hour percentages | Always totals 100%; raising one automatically lowers the other. |
| Time behavior | Four recent and four 24-hour decay bands | Later bands cannot exceed earlier bands; linked values move when needed. |
| Serving response | Exponent, initially 0.75 | Bounded to preserve diminishing returns and avoid implausible amplification. |
| Meter bands | Four ordered display thresholds | Thresholds remain ordered and cannot cross. |
| Actions | Reset defaults; close; save and apply | Draft changes update the preview; saving persists the algorithm. |
Calibration should remain conservative. A repeated family-observed pattern may justify reviewing a food grade or display threshold, but cannot establish a clinical obstruction threshold.
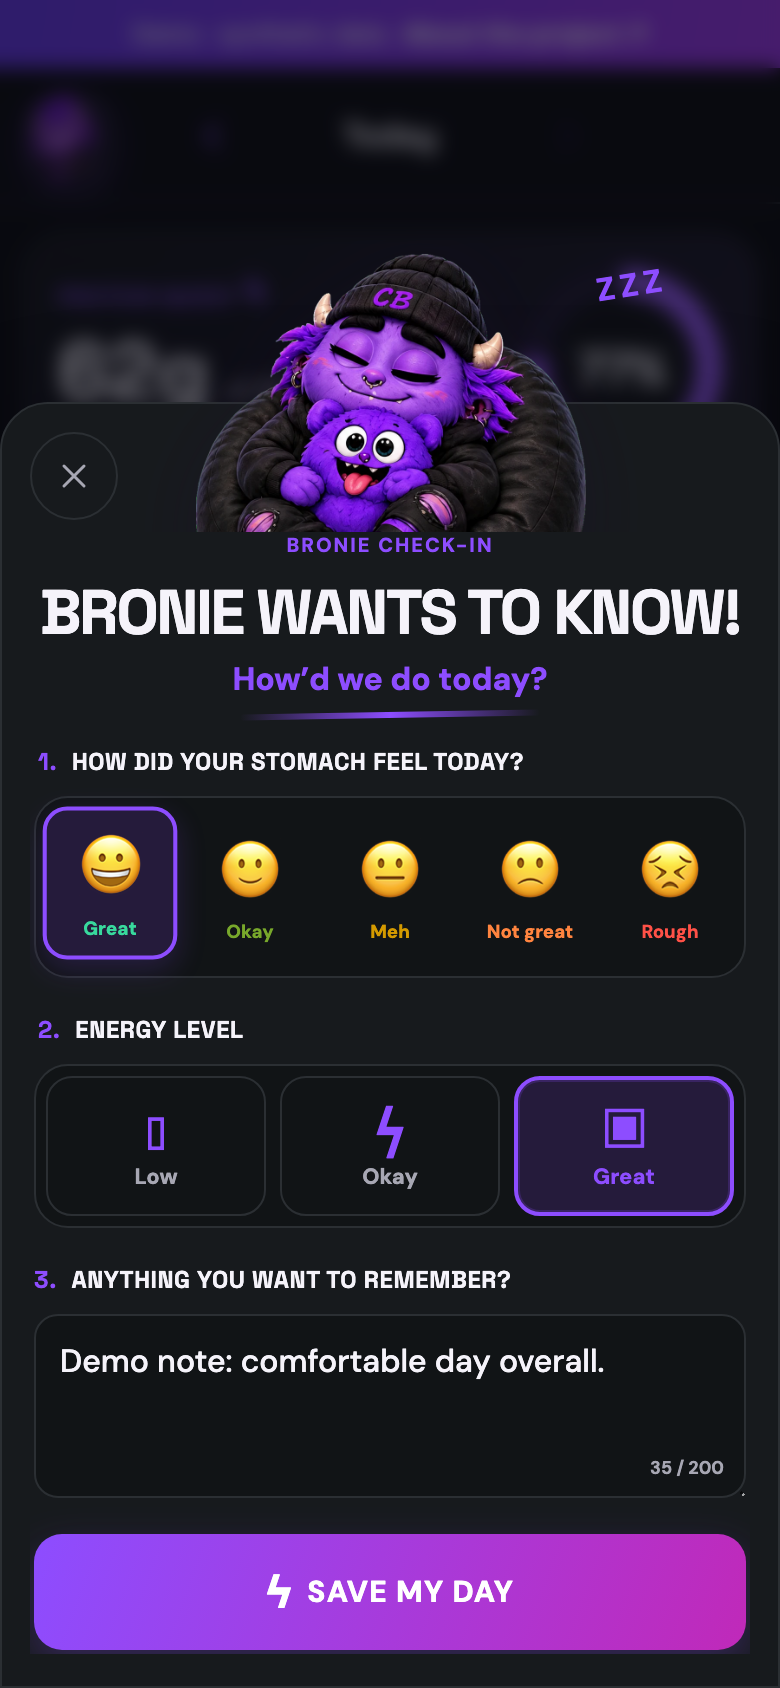
The nightly interaction asks three deliberately small questions: stomach comfort, energy level, and whether there is anything worth remembering. The supportive closing response appears only after submission.
Food logs describe exposure; they do not describe experience. The check-in provides a brief, repeatable outcome measure without requesting symptom detail every time food is recorded.
| Input | Use in reports | Interpretive caution |
|---|---|---|
| Stomach comfort | Five-level ordinal daily outcome | A single rating may summarize several symptoms and contexts. |
| Energy | Three-level secondary outcome | May reflect sleep, school, activity, inflammation, medication, and mood. |
| Optional note | Context for preparation, illness, stress, travel, or unusual days | Free text is valuable but inconsistent and potentially sensitive. |
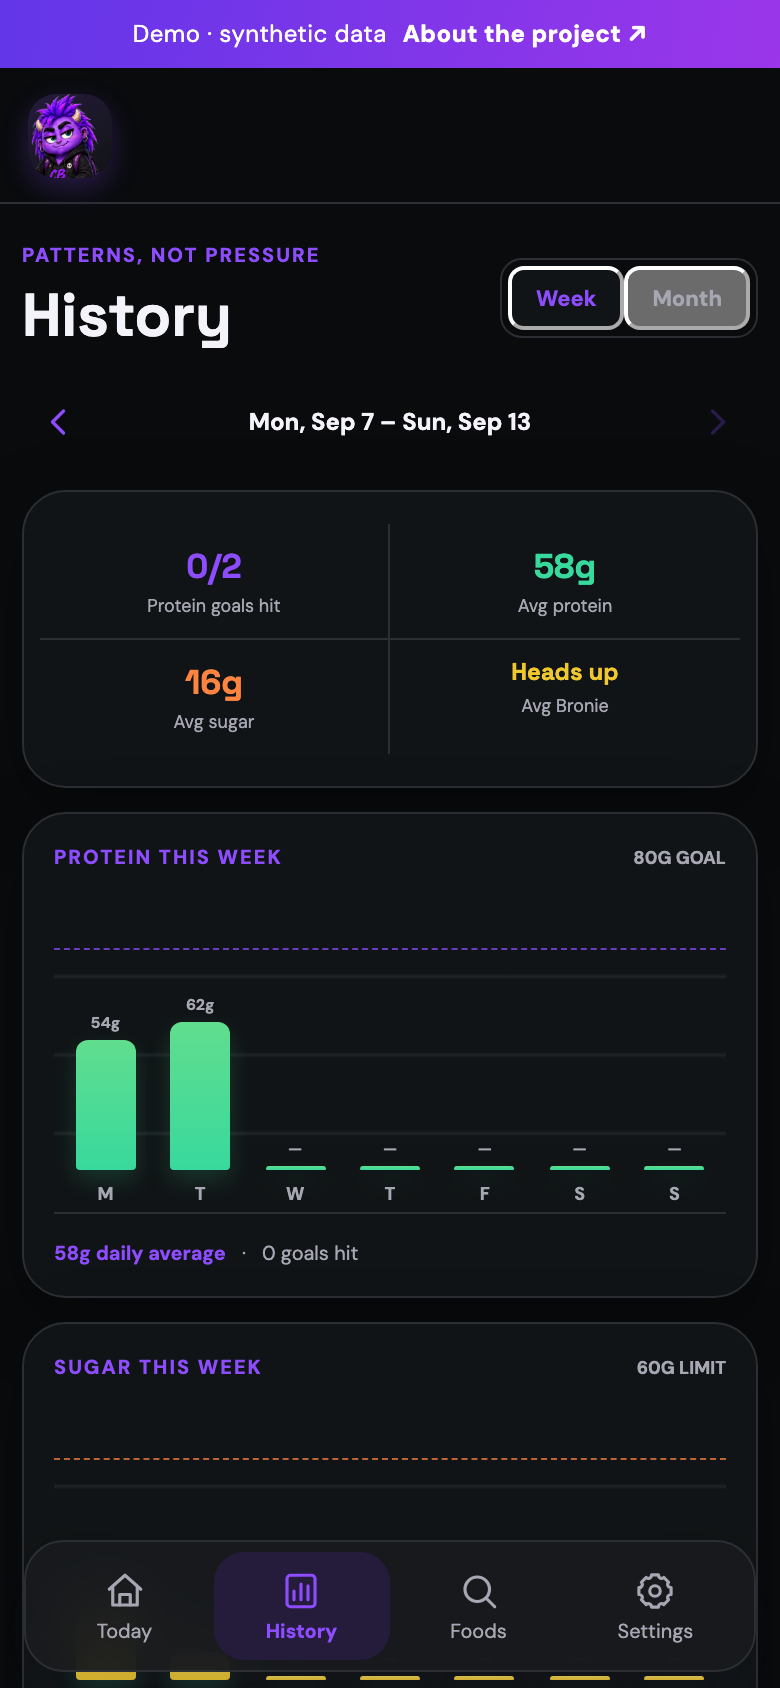
Weekly history supports recall and makes meal timing understandable. The month view displays broader protein, sugar, Bronie, and check-in trends while preserving access to individual days.
The appropriate research question is not “Did food X cause a symptom?” It is “Do certain load patterns tend to occur before or alongside worse self-reported days for this individual?”
| Domain | Candidate daily features |
|---|---|
| Bronie exposure | Peak, average, and end-of-day score; hours above each band; number and size of spikes |
| Food pattern | B0–B4 counts; largest contributor; serving-adjusted load; meal spacing; late-evening load |
| Nutrition | Protein total and goal attainment; sugar total and limit status |
| Self report | Stomach comfort; energy; completion; optional contextual note |
| Timing links | Same-day, 6–12-hour, overnight, and next-day associations |
The project combines clinical guidance, structured food analysis, participatory design, explainable algorithm development, longitudinal single-person observation, and mobile usability evaluation.
| Layer | Method | Contribution |
|---|---|---|
| Clinical framing | IBD organization and hospital dietetics guidance; treating-team review | Defines the mechanical stricture context and discourages unsupported restriction. |
| Food grading | Review of texture, fibre/residue, seeds/skins, density, moisture, chewability, portion, and preparation | Creates a transparent best-estimate B0–B4 starting grade. |
| Participatory refinement | Young person and parent revise foods based on experience and usability | Keeps the library relevant and supports agency. |
| Algorithm design | Nonlinear weights, serving softening, time decay, component blending, and sensitivity scenarios | Transforms discrete grades into a rolling, explainable load. |
| Longitudinal observation | Repeated meal logs, nightly check-ins, and weekly/monthly descriptive reports | Generates personal hypotheses about patterns and time lags. |
| Usability evaluation | Mobile-first review of readability, tap targets, overlays, search anchoring, and logging friction | Reduces burden and supports consistent use. |
Clinical and dietary framing is anchored in reputable patient guidance from IBD organizations and hospital dietetics services. Product decisions are adapted to the individual context. Commercial nutrition values are changeable reference data and should be checked against current labels or restaurant information. Lived experience informs personalization but does not supersede medical advice.
Repeated observations may improve recall and reveal within-person patterns. They cannot demonstrate that a food caused pain, inflammation, or obstruction. There is no control group, exposures are self-selected, symptoms and logging may influence one another, and many confounders remain unmeasured. The work is best described as participatory design and hypothesis-generating n-of-1 observation.
Severe or escalating symptoms require the established clinical plan and urgent medical guidance as appropriate.
Food grades are individualized estimates and are not generalizable to all people with Crohn’s disease or strictures.
A higher score should not produce guilt, punishment, or automatic restriction.
Changes to fibre, texture, or food variety should be discussed with an IBD-focused dietitian or treating clinician.
The young person’s assent, privacy, and control over notes should be respected. Public demonstrations use synthetic data.
Food grades and algorithm settings should be versioned so later interpretation reflects the model active at the time.

Chronie Bronie converts a complicated family concern into a consistent daily record: familiar foods, protein progress, sugar context, cumulative load, and the experience of the person who lived the day. Its purpose is to make uncertainty visible, discussable, and refinable over time.
Open the two-month synthetic demonstration